Climate and mountains shaped human ancestral genetic lineages

So excited to have contributed to this amazing new preprint!
In this study, we quantified the role of climate and mountains in shaping modern and ancient human genetic diversity.

Genomics shows that contemporary human populations result from the mixing of ancestral groups that are genetically distinct (ancestral genetic lineages) with unknown origins. In theory, ancient DNA could help disentangling their origin, but not in this case because we don’t have enough samples of the right age.

For this reason, we used a different strategy. We explicitly simulated the genetic history of humans in their spread out of Africa testing different values for demographic parameters and physiological responses to the changing climate. By doing so we could see if we can reconstruct the observed genetic diversity (spoiler alert: yes) and which parameters and climate variables shaped it.

For example, we find that aridity is the key factor controlling the timing for the out of Africa and mountains can be huge genetic barriers but only in some areas (e.g. Caucasus and Himalayas, not the Urals).

Thanks to this study, not only we could reconstruct such an important part of our genetic history, but we could also quantify the differential role of climate and topography through space and time in our spread out of Africa.

Preprint

Pierpaolo Maisano Delser, Mario Krapp, Robert Beyer, Eppie R Jones, Eleanor F Miller, Anahit Hovhannisyan, Michelle Parker, Veronika Siska, Maria Teresa Vizzari, Elizabeth J. Pearmain, Ivan Imaz-Rosshandler, Michela Leonardi, Gian Luigi Somma, Jason Hodgson, Eirlys Tysall, Zhe Xue, Lara Cassidy, Daniel G Bradley, Anders Eriksson, Andrea Manica
Climate and mountains shaped human ancestral genetic lineages
bioRxiv 2021.07.13.452067; doi: https://doi.org/10.1101/2021.07.13.452067

Abstract

Extensive sequencing of modern and ancient human genomes has revealed that contemporary populations can be explained as the result of recent mixing of a few distinct ancestral genetic lineages. But the small number of aDNA samples that predate the Last Glacial Maximum means that the origins of these lineages are not well understood. Here, we circumvent the limited sampling by modelling explicitly the effect of climatic changes and terrain on population demography and migrations through time and space, and show that these factors are sufficient to explain the divergence among ancestral lineages. Our reconstructions show that the sharp separation between African and Eurasian lineages is a consequence of only a few limited periods of connectivity through the arid Arabian peninsula, which acted as the gate out of the African continent. The subsequent spread across Eurasia was then mostly shaped by mountain ranges, and to a lesser extent deserts, leading to the split of Europeans and Asians, and the further diversification of these two groups. A high tolerance to cold climates allowed the persistence at high latitudes even during the Last Glacial Maximum, maintaining a pocket in Beringia that led to the later, rapid colonisation of the Americas. The advent of food production was associated with an increase in movement, but mountains and climate have been shown to still play a major role even in this latter period, affecting the mixing of the ancestral lineages that we have shown to be shaped by those two factors in the first place.

Genetics and ecology do not agree in reconstructing how birds reacted to past climate changes

A new paper in which I took part is now available in Molecular Ecology

Eleanor F. Miller, Rhys E. Green, Andrew Balmford, Pierpaolo Maisano Delser, Robert Beyer, Marius Somveille, Michela Leonardi, William Amos, Andrea Manica
Bayesian Skyline Plots disagree with range size changes based on Species Distribution Models for Holarctic birds
Molecular Ecology, Volume 30, Issue 16 August 2021 Pages 3993-4004

We analysed more than 100 species of Holarctic birds finding that genetics and ecology do not agree in reconstructing how more they reacted to past climatic fluctuations.

Why should we care? The reconstructions compared in our paper (one based on genetic data, the other on ecological modelling) are widely used to assess how well species can react to the ongoing climate emergency.

In our study, we show that when we systematically compare them for a lot of species they tend to tell us quite different stories. This does not mean that they are wrong: different methods are based on different assumptions, and each of them is likely to be missing a small but significant part of the whole story.

So, when we use these methods, the key is interdisciplinarity: integrating into the analyses different lines of evidence help tackle these limitations and get more reliable results.

Article

Eleanor F. Miller, Rhys E. Green, Andrew Balmford, Pierpaolo Maisano Delser, Robert Beyer, Marius Somveille, Michela Leonardi, William Amos, Andrea Manica
Bayesian Skyline Plots disagree with range size changes based on Species Distribution Models for Holarctic birds
Molecular Ecology, Volume 30, Issue 16 August 2021 Pages 3993-4004 https://doi.org/10.1111/mec.16032

Abstract

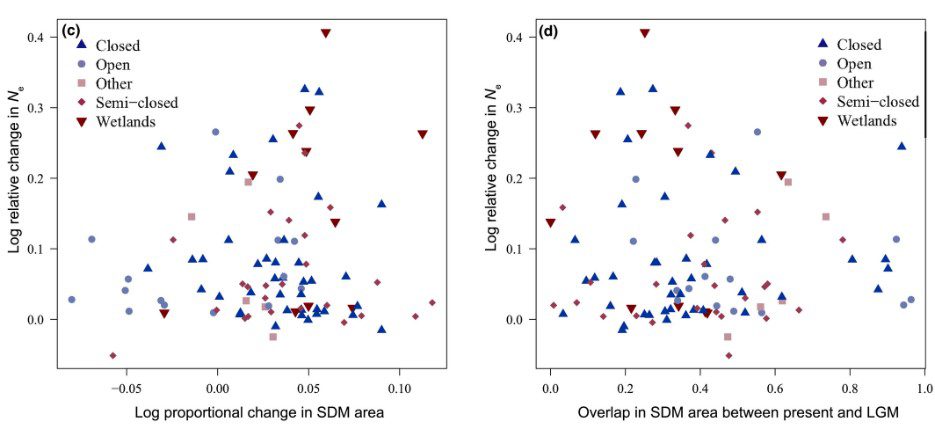
During the Quaternary, large climate oscillations impacted the distribution and demography of species globally. Two approaches have played a major role in reconstructing changes through time: Bayesian Skyline Plots (BSPs), which reconstruct population fluctuations based on genetic data, and Species Distribution Models (SDMs), which allow us to back-cast the range occupied by a species based on its climatic preferences. In this paper, we contrast these two approaches by applying them to a large data set of 102 Holarctic bird species, for which both mitochondrial DNA sequences and distribution maps are available, to reconstruct their dynamics since the Last Glacial Maximum (LGM). Most species experienced an increase in effective population size (Ne, as estimated by BSPs) as well as an increase in geographical range (as reconstructed by SDMs) since the LGM; however, we found no correlation between the magnitude of changes in Ne and range size. The only clear signal we could detect was a later and greater increase in Ne for wetland birds compared to species that live in other habitats, a probable consequence of a delayed and more extensive increase in the extent of this habitat type after the LGM. The lack of correlation between SDM and BSP reconstructions could not be reconciled even when range shifts were considered. We suggest that this pattern might be linked to changes in population densities, which can be independent of range changes, and caution that interpreting either SDMs or BSPs independently is problematic and potentially misleading.

A new explanation for the genetic structure of the Yellow Warbler

A new preprint to which I have contributed is now out on bioRxiv.

When temperate species living in the northern hemisphere are genetically differentiated for no apparent reason, it is likely due to what happened during the last Ice Age.

The expansion of the ice sheets around 21,000 years ago led many species to move to the so-called “glacial refugia”, areas further south where the climate remained milder. If there were multiple refugia isolated from each other, what was previously a single population could divide and differentiate, and then maintain this genetic structure when returning north after the end of the glaciation.

This has happened to many species. It is important, however, not to assume that it’s the reason behind the genetic structure of any species. We tested this hypothesis for the Yellow Warbler (Setophaga petechia), a small passerine bird living in North America.

Male Yellow Warbler (Setophaga petechia).
Photo by Alan Vernon on Flickr. Distributed under the CC BY-NC-SA 2.0 license

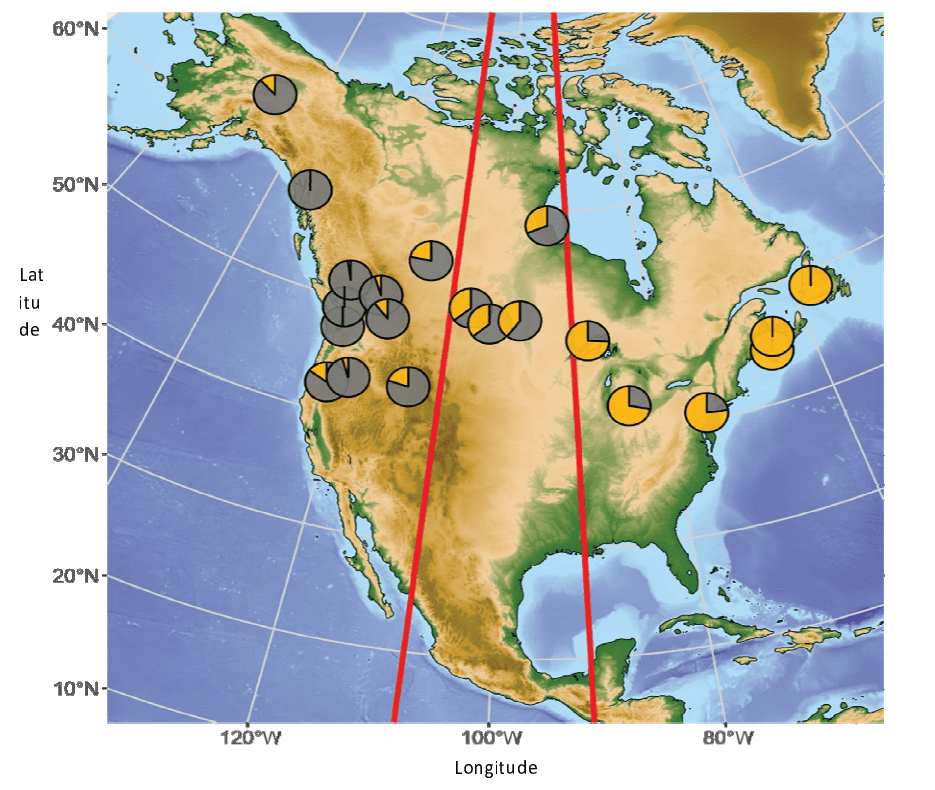
A study on this species found a clear genetic structure: Eastern and Western populations west are quite different from each other, while those living in the middle have intermediate characteristics.

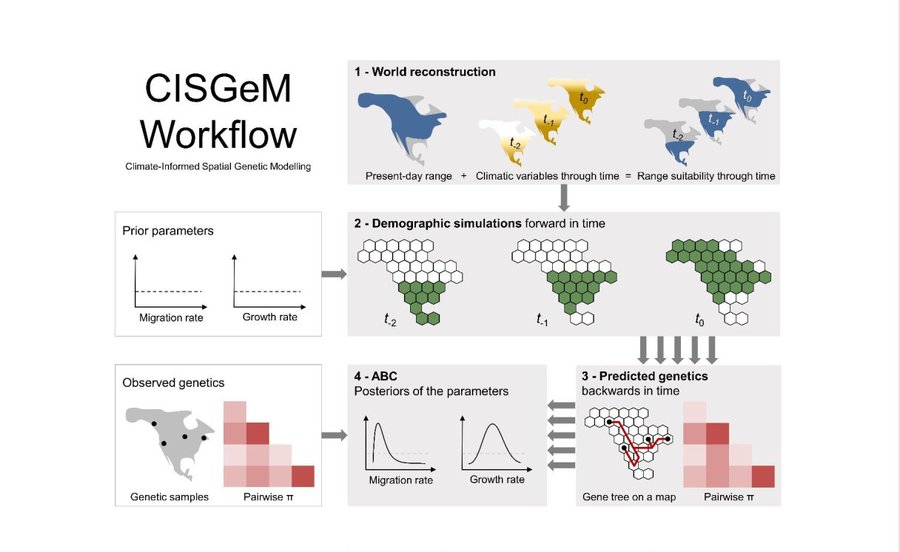
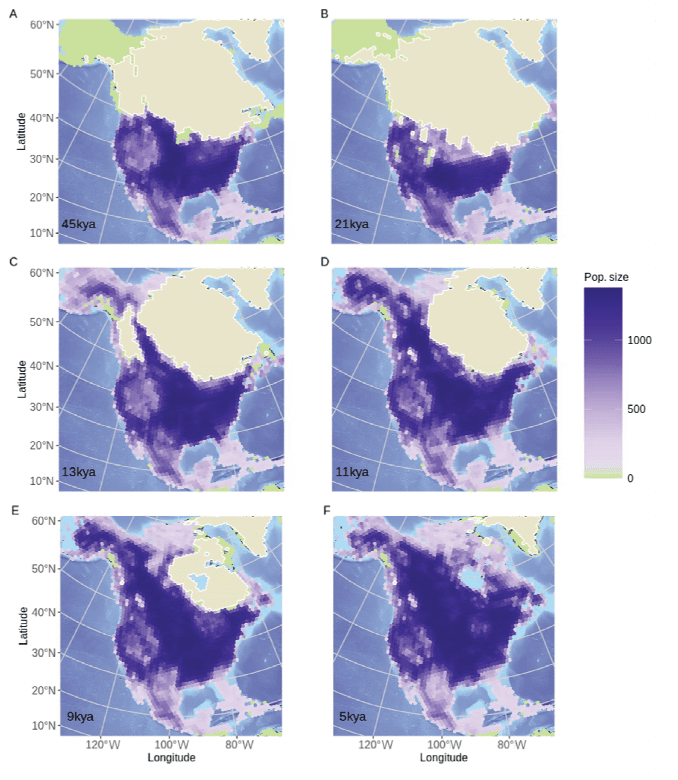
In our study, we explicitly simulated the genetic history of this little bird over the past 50,000 years. In this way, we were able to test whether during the glacial maximum (around 21,000 years ago) the species moved to single or multiple refugia, and what happened during the repopulation of North America after the end of the Ice Age.

Immagine

By doing so, we were able to demonstrate that the yellow warbler had only one glacial refugium; the observed genetic diversity observed is the result of an asymmetric expansion. Ice sheets retreated at different times in the East and the West, and populations moved northward at different times, which created the genetic structure we see today.

It is important to remember that multiple glacial refugia are only one of the possible explanations for modern-day genetic structure: instead of assuming it we should test if it is the most likely explanation for any species of interest.

Preprint

Eleanor F. Miller, Michela Leonardi, Robert Beyer, Mario Krapp, Marius Somveille, Gian Luigi Somma, Pierpaolo Maisano Delser, Andrea Manica
Post-glacial expansion dynamics, not refugial isolation, shaped the genetic structure of a migratory bird, the Yellow Warbler (Setophaga petechia)
bioRxiv 2021.05.10.443405; doi: https://doi.org/10.1101/2021.05.10.443405

ABSTRACT

During the glacial periods of the Pleistocene, swathes of the Northern Hemisphere were covered by ice sheets, tundra and permafrost leaving large areas uninhabitable for temperate and boreal species. The glacial refugia paradigm proposes that, during glaciations, species living in the Northern Hemisphere were forced southwards, forming isolated, insular populations that persisted in disjunct regions known as refugia. According to this hypothesis, as ice sheets retreated, species recolonised the continent from these glacial refugia, and the mixing of these lineages is responsible for modern patterns of genetic diversity. However, an alternative hypothesis is that complex genetic patterns could also arise simply from heterogenous post-glacial expansion dynamics, without separate refugia. Both mitochondrial and genomic data from the North American Yellow warbler (Setophaga petechia) shows the presence of an eastern and western clade, a pattern often ascribed to the presence of two refugia. Using a climate-informed spatial genetic modelling (CISGeM) framework, we were able to reconstruct past population sizes, range expansions, and likely recolonisation dynamics of this species, generating spatially and temporally explicit demographic reconstructions. The model captures the empirical genetic structure despite including only a single, large glacial refugium. The contemporary population structure observed in the data was generated during the expansion dynamics after the glaciation and is due to unbalanced rates of northward advance to the east and west linked to the melting of the icesheets. Thus, modern population structure in this species is consistent with expansion dynamics, and refugial isolation is not required to explain it, highlighting the importance of explicitly testing drivers of geographic structure.

Climate shaped how Neolithic farmers and European hunter-gatherers interacted after a major slowdown from 6,100 BCE to 4,500 BCE

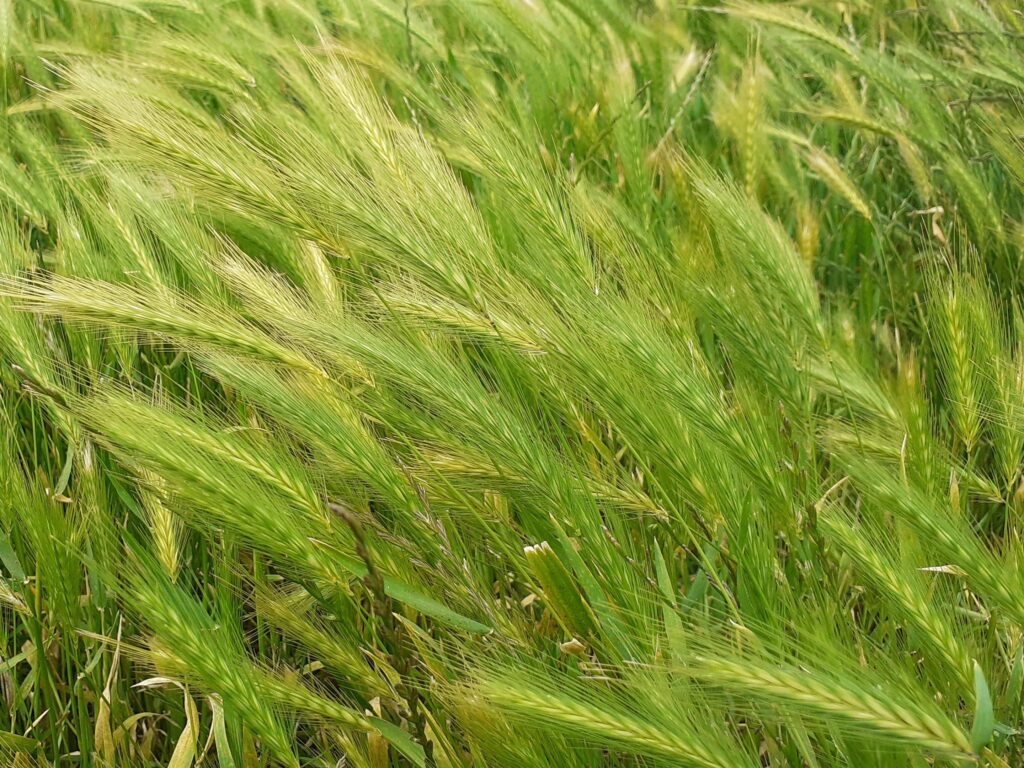
Crops. Photo by Michela Leonardi

It just came out in Nature Human Behaviour a new paper to which I collaborated: Climate shaped how Neolithic farmers and European hunter-gatherers interacted after a major slowdown from 6,100 BCE to 4,500 BCE. The article is behind paywall, but there is a read-only version, and the publisher added the full text in Researchgate.

The Neolithic transition in Europe was driven by the rapid spread of Near Eastern farmers who, over a period of 3,500 years, brought food production to the far corners of the continent. However, this wave of expansion was far from homogeneous, with a marked slowdown observed at higher latitudes, which could be related to the different climatic conditions encountered by Neolithic farmers as they moved.

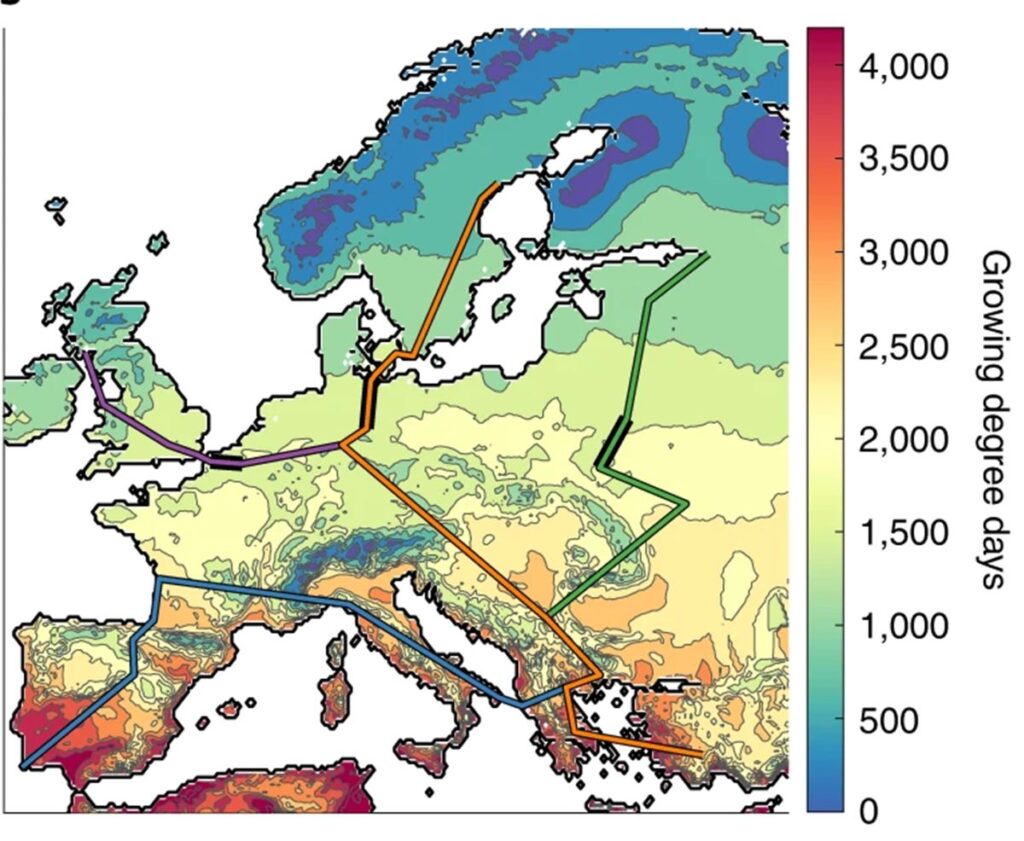
We tested this hypothesis. First, we calculated the expansion routes in the various areas using a large database collating archaeological dates of the first arrival of agriculture throughout Europe. We have identified four of them, shown in the image below.

The four Neolithic expansion routes identified via radiocarbon dates associated with the first appearance of agriculture in the various areas

Along three of these routes, we observed a slowdown (thicker lines in the image) where the value of Growing Degrees Days (reflects the quality of the growing season) exceeds a certain threshold (light green in the map). This suggests that crops that originated in the Near East may have struggled to grow in harsher climatic conditions, not allowing Neolithic populations to produce enough to support population increase and/or expansion.

Furthermore, the study of ancient DNA shows us that in conjunction with the same threshold in growing degree days, ​​the level of admixture between farmers and hunter-gatherers increases, suggesting that unreliable harvests in these regions may have favoured the contact between the two groups.

Lia Betti, Robert M. Beyer, Eppie R. Jones, Anders Eriksson, Francesca Tassi, Veronika Siska, Michela Leonardi, Pierpaolo Maisano Delser, Lily K. Bentley, Philip R. Nigst, Jay T. Stock, Ron Pinhasi & Andrea Manica 

Climate shaped how Neolithic farmers and European hunter-gatherers interacted after a major slowdown from 6,100 BCE to 4,500 BCE

The Neolithic transition in Europe was driven by the rapid dispersal of Near Eastern farmers who, over a period of 3,500 years, brought food production to the furthest corners of the continent. However, this wave of expansion was far from homogeneous, and climatic factors may have driven a marked slowdown observed at higher latitudes. Here, we test this hypothesis by assembling a large database of archaeological dates of first arrival of farming to quantify the expansion dynamics. We identify four axes of expansion and observe a slowdown along three axes when crossing the same climatic threshold. This threshold reflects the quality of the growing season, suggesting that Near Eastern crops might have struggled under more challenging climatic conditions. This same threshold also predicts the mixing of farmers and hunter-gatherers as estimated from ancient DNA, suggesting that unreliable yields in these regions might have favoured the contact between the two groups.

Nat Hum Behav (2020). https://doi.org/10.1038/s41562-020-0897-7

mtDNA-based reconstructions of change in effective population sizes of Holarctic birds do not agree with their reconstructed range sizes based on paleoclimates

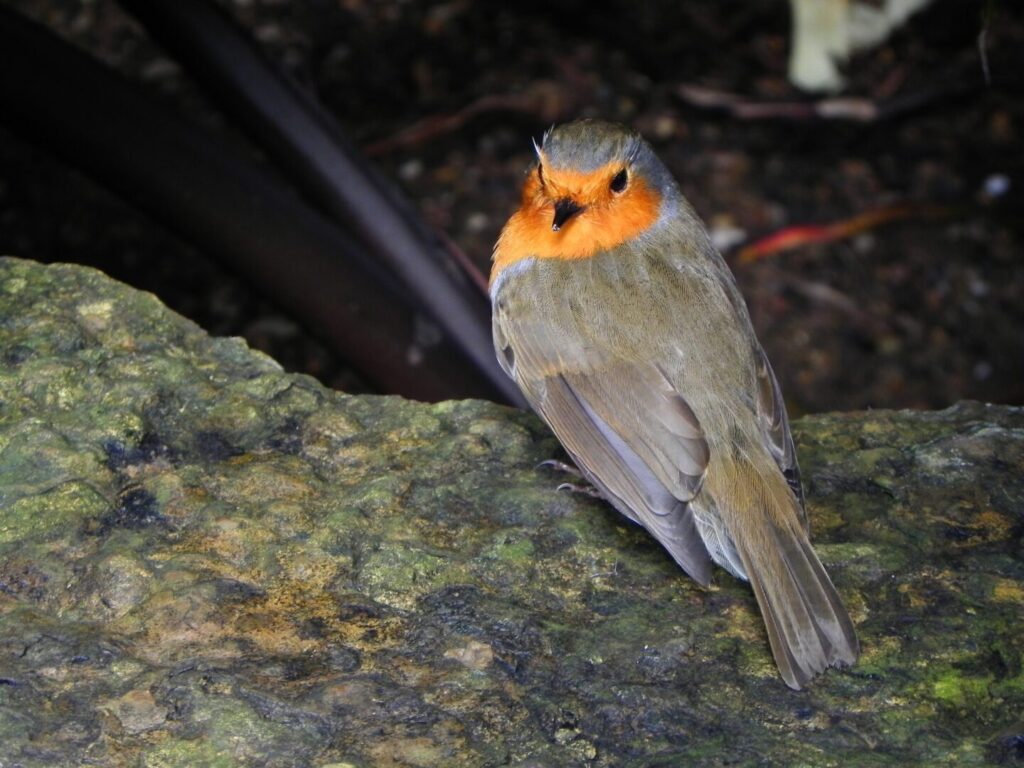
European robin (Erithacus rubecula), picture by Michela Leonardi
European robin (Erithacus rubecula), one of the species analysed in the study.
Picture by Michela Leonardi

A new preprint to which I collaborated was just submitted to BioRxiv: mtDNA-based reconstructions of change in effective population sizes of Holarctic birds do not agree with their reconstructed range sizes based on paleoclimates. The work is led by Eleanor Miller, and was performed under the supervision of Andrea Manica and Bill Amos (University of Cambridge). 

In this article we have studied 102 bird species living in different environments of Eurasia and North America, trying to understand how the climatic changes that occurred after the last glacial maximum (around 21,000 years ago) influenced their demographics . In fact, during the last glacial maximum the climate was much colder, perennial ice covered a large part of the northern hemisphere, and some environments were much more widespread (for example the steppe and cold prairies) while others were much less widespread (for example example forests). For this reason, a difference in the demographic response of species living in different environments could be expected.

Reconstructing the demographics of the past is a very difficult task, there is no method that allows you to do it directly. What can be done is to use different methods that calculate measures that can give us indirect information on what the number of individuals could have been at a given moment. In our article, we used two of these methods, which are based on different data and different assumptions, in order to maximize the amount of information obtained.

The first of these approaches are Bayesian Skyline Plots, which reconstruct the effective population size over time based on mitochondrial DNA. Although the name may be misleading, this measure is not strictly linked to the number of individuals, rather it indicates the degree of genetic variability present in the population. It is based on the assumption that all individuals have the possibility of interbreeding with each other, and the same probability of reproducing: under these conditions, a population with more individuals has a higher genetic variability, for this reason the reconstructions of the effective size are considered informative on demographics. However, they must be interpreted carefully because they can also be influenced by the degree of geographical isolation, by the presence of geographical barriers between groups of individuals, and by many other factors. I will soon be publishing a book chapter on this subject, which clears up some of the more frequent mistakes that can be made in interpreting this kind of information.

The second method is ecological modeling of species distribution (Species Distribution Modelling). This class of methods associates the observations of a species with the environmental or climatic characteristics in which it lives, to reconstruct the potential distribution area both in the present and in the past (or in the future) when simulations of the climate of other periods are available. Again, the size of the distribution area is not directly related to the number of individuals, but this measure is often used as a proxy for demographics assuming that larger distribution areas can support a greater number of individuals.

Our analyses show that when it comes to demographics of the past it is essential not to consider the information drawn from a single method, and to remember that behind every model or measure there are important assumptions that must be tested from time to time. Reality is always more complex than the methods we use to reconstruct it, which is why it is necessary to integrate different approaches in order to be able to have the most complete picture of the situation possible.

Eleanor F. Miller, Rhys E. Green, Andrew Balmford, Robert Beyer, Marius Somveille, Michela Leonardi, William Amos, Andrea Manica

mtDNA-based reconstructions of change in effective population sizes of Holarctic birds do not agree with their reconstructed range sizes based on paleoclimates

During the Quaternary, large climate oscillations had profound impacts on the distribution, demography and diversity of species globally. Birds offer a special opportunity for studying these impacts because surveys of geographical distributions, publicly-available genetic sequence data, and the existence of species with adaptations to life in structurally different habitats, permit large-scale comparative analyses. We use Bayesian Skyline Plot (BSP) analysis of mitochondrial DNA to reconstruct profiles depicting how effective population size (Ne) may have changed over time, focussing on variation in the effect of the last deglaciation among 102 Holarctic species. Only 3 species showed a decline in Ne since the Last Glacial Maximum (LGM) and 7 showed no sizeable change, whilst 92 profiles revealed an increase in Ne. Using bioclimatic Species Distribution Models (SDMs), we also estimated changes in species potential range extent since the LGM. Whilst most modelled ranges also increased, we found no correlation across species between the magnitude of change in range size and change in Ne. The lack of correlation between SDM and BSP reconstructions could not be reconciled even when range shifts were considered. We suggest the lack of agreement between these measures might be linked to changes in population densities which can be independent of range changes. We caution that interpreting either SDM or BSPs independently is problematic and potentially misleading. Additionally, we found that Ne of wetland species tended to increase later than species from terrestrial habitats, possibly reflecting a delayed increase in the extent of this habitat type after the LGM.

bioRxiv 2019.12.13.870410; doi: https://doi.org/10.1101/2019.12.13.870410