pastclim: versione 1.2 e articolo

pastclim, il nostro pacchetto R per facilitare l’uso e la manipolazione di dati paleoclimatici è stato aggiornato alla versione 1.2. Inoltre, è uscito su Ecography l’articolo che lo descrive:

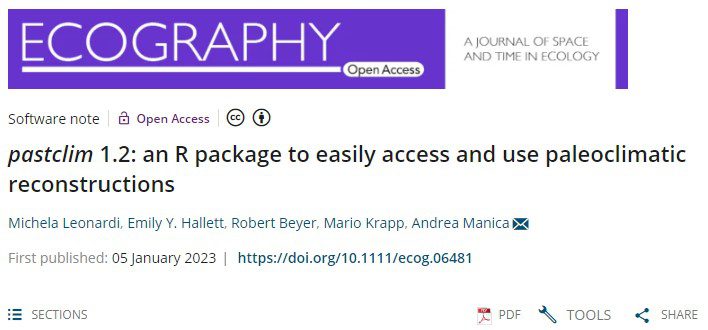
Michela Leonardi, Emily Y. Hallett, Robert Beyer, Mario Krapp, Andrea Manica
pastclim 1.2: an R package to easily access and use paleoclimatic reconstructions
Ecography, First published: 05 January 2023 https://doi.org/10.1111/ecog.06481

Ecco le novità rispetto alla versione presentata nel preprint:

  • pastclim è ora disponibile su CRAN: https://cran.r-project.org/web/packages/pastclim/index.html;
  • Abbiamo aggiunto funzioni per ritagliare i dati sulla base di rettangoli o maschere, e per campionare punti randomicamente nello spazio e nel tempo;
  • Abbiamo creato un cheatsheet, un’infografica che riassume le funzioni principali;
  • Un nuovo set di istruzioni spiega come lavorare con dati paleoclimatici non inclusi nel pacchetto, e come aggiungerli al pacchetto per renderli disponibili a tutti gli utenti.

ed ecco una tabella riassuntiva delle funzioni presenti nel pacchetto

Download the data
get_data_path()Retrieve the path in which pastclim automatically stores the data
set_data_path()Store the data in a custom path
download_dataset()Download a whole dataset (all variables available)
get_vars_for_dataset()
Download variables of choice for a given dataset
get_downloaded_datasets()Summary of the downloaded variables
get_time_steps()List of time steps available in a given dataset
Get climate for locations or regions
location_slice()Get the climate for given locations (by coordinates and age)
location_series()Get time series of the climate for given locations
region_slice()get the climate for a given region in a given time step
sample_region_slice()sample a given number of points from the climate of a region
region_series()get the time series of the climate for a given region
sample_region_series()sample a given series of points from the time series of a region
Working with biomes and ice sheets
get_biome_classes()legend of the ‘biome’ categorical variable, when available
get_ice_mask()get a mask with the extent of the ice sheets for a given time step
get_land_mask()get a mask with the extent of the land masses for a given time step
Vignettes
vignette(“pastclim_overview”, package = “pastclim”)overview of pastclim
vignette(“custom_datasets”, package = “pastclim”)how to add a new dataset to pastclim
vignette(“available_datasets”, package = “pastclim”)list of datasets available

Per maggiori informazioni:

sito web: https://evolecolgroup.github.io/pastclim/index.html
istruzioni: https://rdrr.io/github/EvolEcolGroup/pastclim/
repository github: https://github.com/EvolEcolGroup/pastclim
CRAN: https://cran.r-project.org/web/packages/pastclim/index.html
vignette: https://evolecolgroup.github.io/pastclim/articles/a0_pastclim_overview.html
cheatsheet: evolecolgroup.github.io/pastclim/pastclim_cheatsheet.pdf

per segnalare un problema

https://github.com/EvolEcolGroup/pastclim/issues

L’impatto dell’ultimo massimo glaciale sugli ungulati europei

È uscito nella rivista “Communications biology” l’articolo che abbiamo scritto con Andrea Manica (Cambridge), Francesco Boschin e Paolo Boscato (Siena).

Michela Leonardi, Francesco Boschin, Paolo Boscato & Andrea Manica
Following the niche: the differential impact of the last glacial maximum on four European ungulates
Communications Biology volume 5, Article number: 1038 (2022)

Cosa è successo agli ungulati temperati in Europa durante le fluttuazioni climatiche che hanno interessato gli ultimi 50.000 anni? Per rispondere a questa domanda abbiamo raccolto un database di date al radiocarbonio associate a resti di cavallo, uro, cervo e cinghiale tra 47.000 e 7.500 anni fa (in modo da escludere individui domestici).

Abbiamo analizzato questi dati con un nuovo metodo che ricostruisce la nicchia ecologica (realizzata) nel tempo, e permette di testare se è rimasta stabile o è cambiata. Tutte le specie analizzate hanno cambiato la loro nicchia, principalmente durante l’ultimo massimo glaciale o subito dopo, con uno schema coerente con le preferenze individuali in termini di habitat. Sembra che siano sopravvissuti ai cambiamenti climatici grazie alla loro flessibilità e all’espansione della loro nicchia in risposta all’estinzione di altre specie animali avvenute i quel periodo (sia competitori, sia predatori).

In termini più generali, con questo studio dimostriamo che anche specie grandi, con tempi di generazione lunghi, possono cambiare la loro nicchia nel corso di poche migliaia di anni. Questo deve suggerire estrema cautela quando si assume che la nicchia ecologica rimanga costante sia quando si ricostruisce il passato sia quando si prevede il futuro.

E se siete arrivati a leggere fino a qui, ecco una piccola sorpresa per premiarvi dell’impegno!

Articolo

Michela Leonardi, Francesco Boschin, Paolo Boscato & Andrea Manica
Following the niche: the differential impact of the last glacial maximum on four European ungulates
Communications Biology volume 5, Article number: 1038 (2022) DOI: 10.1038/s42003-022-03993-7

Abstract

Predicting the effects of future global changes on species requires a better understanding of the ecological niche dynamics in response to climate; the large climatic fluctuations of the last 50,000 years can be used as a natural experiment to that aim. Here we test whether the realized niche of horse, aurochs, red deer, and wild boar changed between 47,000 and 7500 years ago using paleoecological modelling over an extensive archaeological database. We show that they all changed their niche, with species-specific responses to climate fluctuations. We also suggest that they survived the climatic turnovers thanks to their flexibility and by expanding their niche in response to the extinction of competitors and predators. Irrespective of the mechanism behind such processes, the fact that species with long generation times can change their niche over thousands of years cautions against assuming it to stay constant both when reconstructing the past and predicting the future.

La genetica e l’ecologia danno risultati contrastanti sull’effetto dei cambiamenti climatici del passato sugli uccelli

Un nuovo articolo a cui ho lavorato è uscito su Molecular Ecology

Eleanor F. Miller, Rhys E. Green, Andrew Balmford, Pierpaolo Maisano Delser, Robert Beyer, Marius Somveille, Michela Leonardi, William Amos, Andrea Manica
Bayesian Skyline Plots disagree with range size changes based on Species Distribution Models for Holarctic birds
Molecular Ecology, Volume 30, Issue 16 August 2021 Pages 3993-4004

Abbiamo analizzato più di 100 specie di uccelli dell’emisfero Nord, scoprendo che la genetica e l’ecologia non concordano nel ricostruire come hanno reagito alle fluttuazioni climatiche del passato.

Perché è interessante? Le ricostruzioni messe a confronto nel nostro articolo (una basata su dati genetici, l’altra su modelli ecologici) sono normalmente utilizzate per valutare come le specie possono reagire all’attuale emergenza climatica.

Nel nostro studio, dimostriamo che quando confrontiamo questi due metodi in maniera sistematica per molte specie tendono a raccontarci storie abbastanza diverse. Ciò non significa che si sbagliano: metodi diversi si basano su presupposti diversi, ed è probabile che a ciascuno di essi manchi una parte piccola ma significativa dell’intera storia.

Quindi, quando usiamo questi metodi, la chiave è l’interdisciplinarietà: l’integrazione nelle analisi di diversi tipi di dati aiuta ad affrontare queste limitazioni e ottenere risultati più affidabili.

Articolo

Eleanor F. Miller, Rhys E. Green, Andrew Balmford, Pierpaolo Maisano Delser, Robert Beyer, Marius Somveille, Michela Leonardi, William Amos, Andrea Manica
Bayesian Skyline Plots disagree with range size changes based on Species Distribution Models for Holarctic birds
Molecular Ecology, Volume 30, Issue 16 August 2021 Pages 3993-4004 https://doi.org/10.1111/mec.16032

Abstract

During the Quaternary, large climate oscillations impacted the distribution and demography of species globally. Two approaches have played a major role in reconstructing changes through time: Bayesian Skyline Plots (BSPs), which reconstruct population fluctuations based on genetic data, and Species Distribution Models (SDMs), which allow us to back-cast the range occupied by a species based on its climatic preferences. In this paper, we contrast these two approaches by applying them to a large data set of 102 Holarctic bird species, for which both mitochondrial DNA sequences and distribution maps are available, to reconstruct their dynamics since the Last Glacial Maximum (LGM). Most species experienced an increase in effective population size (Ne, as estimated by BSPs) as well as an increase in geographical range (as reconstructed by SDMs) since the LGM; however, we found no correlation between the magnitude of changes in Ne and range size. The only clear signal we could detect was a later and greater increase in Ne for wetland birds compared to species that live in other habitats, a probable consequence of a delayed and more extensive increase in the extent of this habitat type after the LGM. The lack of correlation between SDM and BSP reconstructions could not be reconciled even when range shifts were considered. We suggest that this pattern might be linked to changes in population densities, which can be independent of range changes, and caution that interpreting either SDMs or BSPs independently is problematic and potentially misleading.

L’effetto del clima sul processo di Neolitizzazione dell’Europa

È appena uscito in Nature Human Behaviour un nuovo articolo a cui ho collaborato: Climate shaped how Neolithic farmers and European hunter-gatherers interacted after a major slowdown from 6,100 BCE to 4,500 BCE. L’articolo è a pagamento, ma c’è un link che permette di leggerlo gratuitamente e la rivista ha pubblicato il pdf su Researchgate.

La transizione neolitica in Europa è stata guidata dalla rapida dispersione degli agricoltori del Vicino Oriente che, in un periodo di 3.500 anni, hanno portato la produzione alimentare negli angoli più remoti del continente. Tuttavia, questa ondata di espansione è stata tutt’altro che omogenea , con un marcato rallentamento osservato a latitudini più elevate,che potrebbe essere legato alle diverse condizioni climatiche che gli agricoltori neolitici hanno incontrato nei loro spostamenti.

Abbiamo testato questa ipotesi. Per prima cosa, abbiamo calcolato le rotte di espansione nelle varie zone usando un vasto database che raccoglie le date archeologiche del primo arrivo dell’agricoltura in tutta Europa. Ne abbiamo identificate quattro, mostrate nell’imagine qui sotto.

Le quattro rote di espansione Neolitica identificate tramite le date al radiocarbonio associate alla prima comparsa dell’agricoltura nelle varie zone

Lungo tre di queste rotte, si nota un rallentamento (linee più spesse nell’immagine) al sumperamento di una certa soglia (verde chiaro nella mappa) nella somma termica, un valore che riflette la qualità della stagione di crescita. Questo suggerisce che le colture, provenienti dal Vicino Oriente, potrebbero aver faticato in condizioni climatiche più difficili, non permettendo alle popolazioni Neolitiche di produrre abbastanza per sostenere un aumento della popolazione e/o un’espansione.

Lo studio del DNA antico, inoltre, ci mostra che in concomitanza dei valori soglia di somma termica aumenta il livello di mescolanza fra agricoltori e cacciatori-raccoglitori, suggerendo che i raccolti inaffidabili in queste regioni potrebbero aver favorito il contatto tra i due gruppi.

Lia Betti, Robert M. Beyer, Eppie R. Jones, Anders Eriksson, Francesca Tassi, Veronika Siska, Michela Leonardi, Pierpaolo Maisano Delser, Lily K. Bentley, Philip R. Nigst, Jay T. Stock, Ron Pinhasi & Andrea Manica 

Climate shaped how Neolithic farmers and European hunter-gatherers interacted after a major slowdown from 6,100 BCE to 4,500 BCE

The Neolithic transition in Europe was driven by the rapid dispersal of Near Eastern farmers who, over a period of 3,500 years, brought food production to the furthest corners of the continent. However, this wave of expansion was far from homogeneous, and climatic factors may have driven a marked slowdown observed at higher latitudes. Here, we test this hypothesis by assembling a large database of archaeological dates of first arrival of farming to quantify the expansion dynamics. We identify four axes of expansion and observe a slowdown along three axes when crossing the same climatic threshold. This threshold reflects the quality of the growing season, suggesting that Near Eastern crops might have struggled under more challenging climatic conditions. This same threshold also predicts the mixing of farmers and hunter-gatherers as estimated from ancient DNA, suggesting that unreliable yields in these regions might have favoured the contact between the two groups.

Nat Hum Behav (2020). https://doi.org/10.1038/s41562-020-0897-7

5000 anni di allevamento del cavallo alla luce del DNA antico

A herd of Kazakh horses in the Pavlodar region of Kazakhstan in August 2016.
Credit: Ludovic Orlando

È appena uscito su Cell un articolo al quale ho lavorato, “Tracking five millennia of horse management with extensive ancient genome time series“, risultato della collaborazione fra più di cento scienziati e scienziate da centri di ricerca in giro per il mondo. I primi autori sono Antoine Fages, Kristian Hanghøj e Naveed Khan, e l’ultimo è Ludovic Orlando (Università di Tolosa e Copenaghen).

La domesticazione del cavallo è stato un processo che ha cambiato radicalmente la storia umana, soprattutto in Eurasia: ha rivoluzionato la guerra, e accelerato viaggi, commerci e l’espansione geografica delle lingue. In questo studio presentiamo il più grande campionamento di DNA antico per un organismo non umano: 129 genomi completi, e dati parziali da altri 149 animali. Questi dati ci consentono di capire quanto delle civiltà equestri del passato e arrivato fino a noi.

Al tempo della prima domesticazione del cavallo (circa 5000 anni fa in Asia Centrale) c’erano due gruppi geneticamente diversi di cavalli in Eurasia, uno in Iberia) e l’altro in Siberia. Entrambi sono estinti, e nessuno dei due ha lasciato tracce significative nel DNA dei cavalli moderni. Invece, i cavalli persiano hanno avuto un’influenza importante, soprattutto in seguito alle conquiste islamiche in Europa e in Asia. Le varianti genetiche associate alle corse, incluso il “gene della velocità” MSTN, sono diventati popolari solo nell’ultimo millennio. Infine, lo sviluppo dell’allevamento moderno ha avuto un impatto sulla diversità genetica in modo più drammatico rispetto ai periodi precedenti, ed è stato accompagnate da un calo significativo della variabilità genetica.

Antoine Fages, Kristian Hanghøj, Naveed Khan, Charleen Gaunitz, Andaine Seguin-Orlando, Michela Leonardi, [116 more authors] and Ludovic Orlando

Tracking five millennia of horse management with extensive ancient genome time series
Graphical abstract
Riassunto grafico

Horse domestication revolutionized warfare and accelerated travel, trade, and the geographic expansion of languages. Here, we present the largest DNA time series for a non-human organism to date, including genome-scale data from 149 ancient animals and 129 ancient genomes (≥1-fold coverage), 87 of which are new. This extensive dataset allows us to assess the modern legacy of past equestrian civilizations. We find that two extinct horse lineages existed during early domestication, one at the far western (Iberia) and the other at the far eastern range (Siberia) of Eurasia. None of these contributed significantly to modern diversity. We show that the influence of Persian-related horse lineages increased following the Islamic conquests in Europe and Asia. Multiple alleles associated with elite-racing, including at the MSTN “speed gene,” only rose in popularity within the last millennium. Finally, the development of modern breeding impacted genetic diversity more dramatically than the previous millennia of human management.

Cell, Volume 177, Issue 6, 30 May 2019, Pages 1419-1435.e31
DOI: https://doi.org/10.1016/j.cell.2019.03.049